Urbanization, and the Struggle for Permits in California’s Aggregate Market
California is home to one of the largest and most dynamic aggregate markets in the U.S., driven by its massive population, ongoing urbanization, and extensive infrastructure needs. Sand, gravel, and crushed stone are essential components of concrete and asphalt and are the backbone of the state’s construction and public works projects. These materials are critical for building and maintaining roads, bridges, highways, airports, and housing developments that support California’s ever-expanding population.
The state produces over 200 million tons of aggregates annually, with significant mining operations concentrated in regions such as Los Angeles and San Bernardino Counties, the Central Valley, and the Bay Area. Despite this high production, the demand for aggregates continues to outpace supply due to increasing development, stricter environmental regulations, and growing public opposition to new mining projects. As a result, California’s construction industry may need to rely more heavily on costly imports to meet future demand, which will likely impact infrastructure costs and project timelines.
Urbanization and Development Trends
California’s rapid urbanization has brought development projects closer to aggregate sources. Key factors driving this trend include:
• Massive Population: Although California has experienced a slight decrease in population in recent years, it remains the most populous states in the U.S., which fuels the demand for housing, commercial spaces, and expanded transportation networks. The state’s major metropolitan areas, including Los Angeles, San Francisco, and San Diego, are consistently working to improve infrastructure, leading to increased construction activity and, in turn, a continuing reliance on aggregates.
• Housing Expansion: The rising demand for housing has pushed new developments into previously undeveloped areas. Many of these areas contain valuable aggregate resources, creating conflicts over land use. This expansion not only increases the need for construction materials but also raises concerns about preserving the long-term availability of mineral resources.
• Infrastructure Modernization: California’s aging infrastructure requires extensive upgrades, including road repairs, bridge replacements, and public transit expansions. These projects rely heavily on aggregates, further increasing the strain on local supply.
Impact on Key Regions
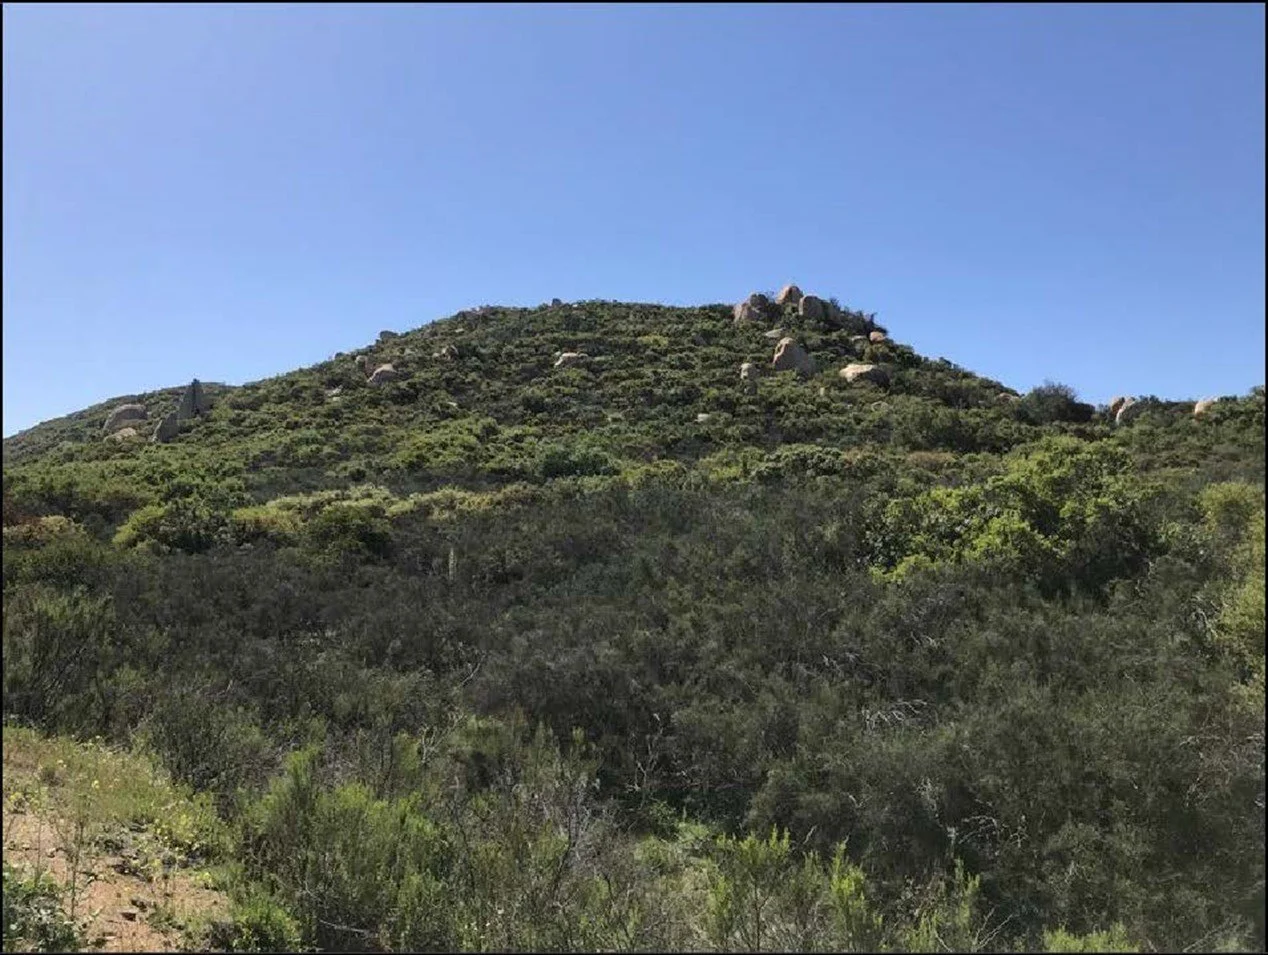
The effects of urbanization on aggregate resources are particularly evident in major metropolitan areas such as Los Angeles and the Bay Area. Irwindale, which historically has been a significant aggregate producer for the greater Los Angeles region, has seen increased urban expansion and redevelopment projects. Over the years, several mines have been repurposed for commercial and residential developments, limiting the availability of local aggregates. In addition, many of the major production sites have been depleted or are nearing depletion. San Bernardino County, another key aggregate supplier, faces growing concerns as new communities develop closer to mining areas, raising questions about future land use disputes and potential regulatory restrictions.
In the Bay Area, a housing and infrastructure boom has placed immense pressure on local aggregate sources, particularly in Pleasanton and Livermore. Residents have raised environmental concerns regarding hazardous land movement, diminished air and water quality, and the destruction of natural habitats due to mining activities. This growing opposition could result in more restrictive regulations, further complicating aggregate availability in the region. Sacramento is another area experiencing rapid population growth, leading to urban expansion into areas rich in aggregate resources. As communities continue to expand, mining operations in these areas may face increasing pushback, making it more difficult to obtain permits for new or the expansion of existing production sites.
Future Outlook
As California’s population remains the largest in the U.S., the demand for construction aggregates will continue to rise. However, the state’s 50-year aggregate demand exceeds the remaining permitted reserves by more than 3 billion tons. While urbanization drives demand for aggregates, it also presents challenges, including stricter environmental regulations and rising concerns from local residents regarding noise, dust, and transportation impacts. Balancing development with resource availability will be critical for the future of California’s construction industry. Without significant changes, California may struggle to meet future infrastructure needs.
Key Challenges and Solutions
• Reliance on Imports: If California’s aggregate supply gap continues to grow, the construction industry will be forced to import materials from neighboring states or even overseas. This reliance on imports will drive up costs substantially, impact project timelines, and increase transportation-related carbon emissions. Companies will need to find cost-effective ways to secure aggregate supplies while maintaining resource affordability.
• Expanding Permitted Reserves: The mining industry will need to push for additional aggregate reserves to be permitted, but this will require navigating complex regulatory hurdles and community opposition. State and local governments play a crucial role in balancing resource development with environmental concerns.
• Sustainable Alternatives: With increasing pressure to reduce environmental impacts, there is a growing demand for identifying sustainable resources and the utilization of recycled materials. The construction industry is exploring alternatives such as recycled concrete and asphalt to offset the need for new aggregate extraction. Mining operators will need to invest in advanced recycling technology to improve efficiency and reduce reliance on newly mined materials.
• Regulatory and Environmental Considerations: As California enforces stricter environmental policies, aggregate producers must adapt to evolving regulations that address air quality, noise pollution, and land rehabilitation. Proactively engaging with communities and policymakers to address concerns will be essential for securing future mining permits.
• Increased Transportation Costs: If existing mining operations are unable to renew their permits due to nearby infrastructure projects, aggregates will need to be transported from greater distances, resulting in significantly higher economic and societal costs. The fact that transportation costs will increase as aggregates are hauled from greater distances is an easy concept to understand, however the broader consequences are equally important. Longer hauling distances leads to more wear and tear on highways, increased traffic congestion, and higher carbon emissions. To mitigate these unintended consequences, prioritizing local aggregate sources would appear to be a commonsense solution.
Opportunities Amid Challenges
Despite these challenges, urbanization also presents opportunities for the aggregate industry:
• Increased Demand for Infrastructure Projects: As California continues to grow, the need for roads, bridges, public transit systems, and commercial developments will drive demand for aggregates. The aggregate industry will remain a critical player in shaping the state’s future landscape.
• Innovation and Sustainability: Companies that invest in eco-friendly solutions, such as carbon capture technology, water-efficient processing, and alternative aggregate materials, may gain a competitive edge in the evolving construction landscape.
• Potential Cost Savings in Transportation: As urban expansion moves closer to existing aggregate production facilities, transportation costs may decrease, improving the efficiency and affordability of projects. This could help offset some of the financial burdens associated with mining restrictions and environmental regulations. However, this assumes that mining operations will be able to renew permits as communities move closer to production sites, which is easier said than done.
Mineral Land Classification Process
The classification and designation of mineral lands in California are designed to ensure access to valuable mineral resources while balancing land-use conflicts. The Surface Mining and Reclamation Act of 1975 (SMARA) was established to regulate mining activities and prevent the permanent loss of mineral-rich lands to urban development and other irreversible land uses. Under SMARA, the State Geologist is tasked with classifying lands based on mineral potential, while the State Mining and Geology Board (SMGB) oversees the designation of mineral lands deemed to have regional or statewide significance.
The classification of mineral lands is designed to identify and protect economically significant mineral resources, primarily construction aggregates (sand, gravel, and crushed stone) essential for infrastructure. However, it also includes industrial minerals (clay, gypsum, borates), metallic minerals (gold, silver, rare earths), and some energy resources. These materials support construction, manufacturing, and clean energy technologies. Mineral Resource Zone (MRZ) designations help guide land-use planning by identifying valuable resources so that they can be protected from urban development. In theory, this should ensure the availability of long-term supplies to service economic growth and infrastructure needs. Local governments must consider these classifications in planning decisions to balance resource conservation with development. The process prioritizes areas at risk of being rendered unavailable for future mining due to urban expansion, regulatory restrictions, or land-use conflicts.
Mineral Resource Classification Process
Classification Priorities – The State Geologist, guided by recommendations from the SMGB and public input, prioritizes areas most at risk from urban development or incompatible land uses. In most cases, these resources are found in close proximity to urban land uses, thereby reducing the need to transport the resources over extended distances.
Classification Criteria – The classification of mineral lands follows a systematic approach based on geologic and economic factors rather than existing land use or ownership. A mineral deposit is classified as significant if it meets specific marketability and economic threshold criteria.
Marketability: The deposit must be minable, processable, and marketable under current or reasonably foreseeable economic and technological conditions.
Threshold Value: Deposits must meet a minimum economic value to qualify as significant. For example:
Construction materials (e.g., sand, gravel, crushed rock): $12.5-million (1998-adjusted value).
Industrial minerals (e.g., limestone, clay, gypsum): $2.5-million.
Metallic and rare minerals (e.g., gold, silver, copper, uranium): $1.25-million.
Mineral Resource Zones (MRZs)
The California Mineral Land Classification System divides lands into four MRZ categories, providing a structured assessment of mineral resource potential.
MRZ-1: No significant mineral deposits are identified. These areas have a low likelihood of containing economic mineral resources.
MRZ-2: Areas where significant mineral deposits are present.
MRZ-2a: Deposits with measured or indicated resources (proven economic value).
MRZ-2b: Deposits with inferred resources, requiring further exploration to confirm economic feasibility.
MRZ-3: Lands with known mineral deposits of undetermined economic significance. These areas may contain valuable minerals but lack sufficient data.
MRZ-4: Areas where mineral potential is unknown due to a lack of sufficient geologic information.
For mining operators, securing permits in MRZ-2 zones is strategically advantageous, as these areas are already identified as containing significant mineral resources in close proximity to market areas.
Designation of Mineral Lands
Designation is a separate but complementary process to classification. While classification identifies mineral-rich lands, designation formally recognizes their economic importance at a regional or statewide level. In theory, this designation provides additional regulatory protections to prevent premature land-use decisions that could preclude mining.
Key Designation Criteria:
The presence of mineral deposits of regional or statewide significance.
The economic importance of these deposits to California’s mineral supply.
The threat of land-use changes that could render the resources inaccessible.
Once designated, these lands are subject to enhanced regulatory oversight to safeguard their availability for future extraction.
Implications for Mining Operators
For operators planning development within or near an MRZ, understanding the classification and designation framework is crucial. Mining in MRZ-2a or MRZ-2b areas provides regulatory advantages due to pre-established economic significance. However, MRZ-3 and MRZ-4 areas may require extensive exploration and documentation to establish economic feasibility. Where exploration documents the presence of high quality resources, classification can be achieved through consideration by the State Geologist.
Determining Economic Viability
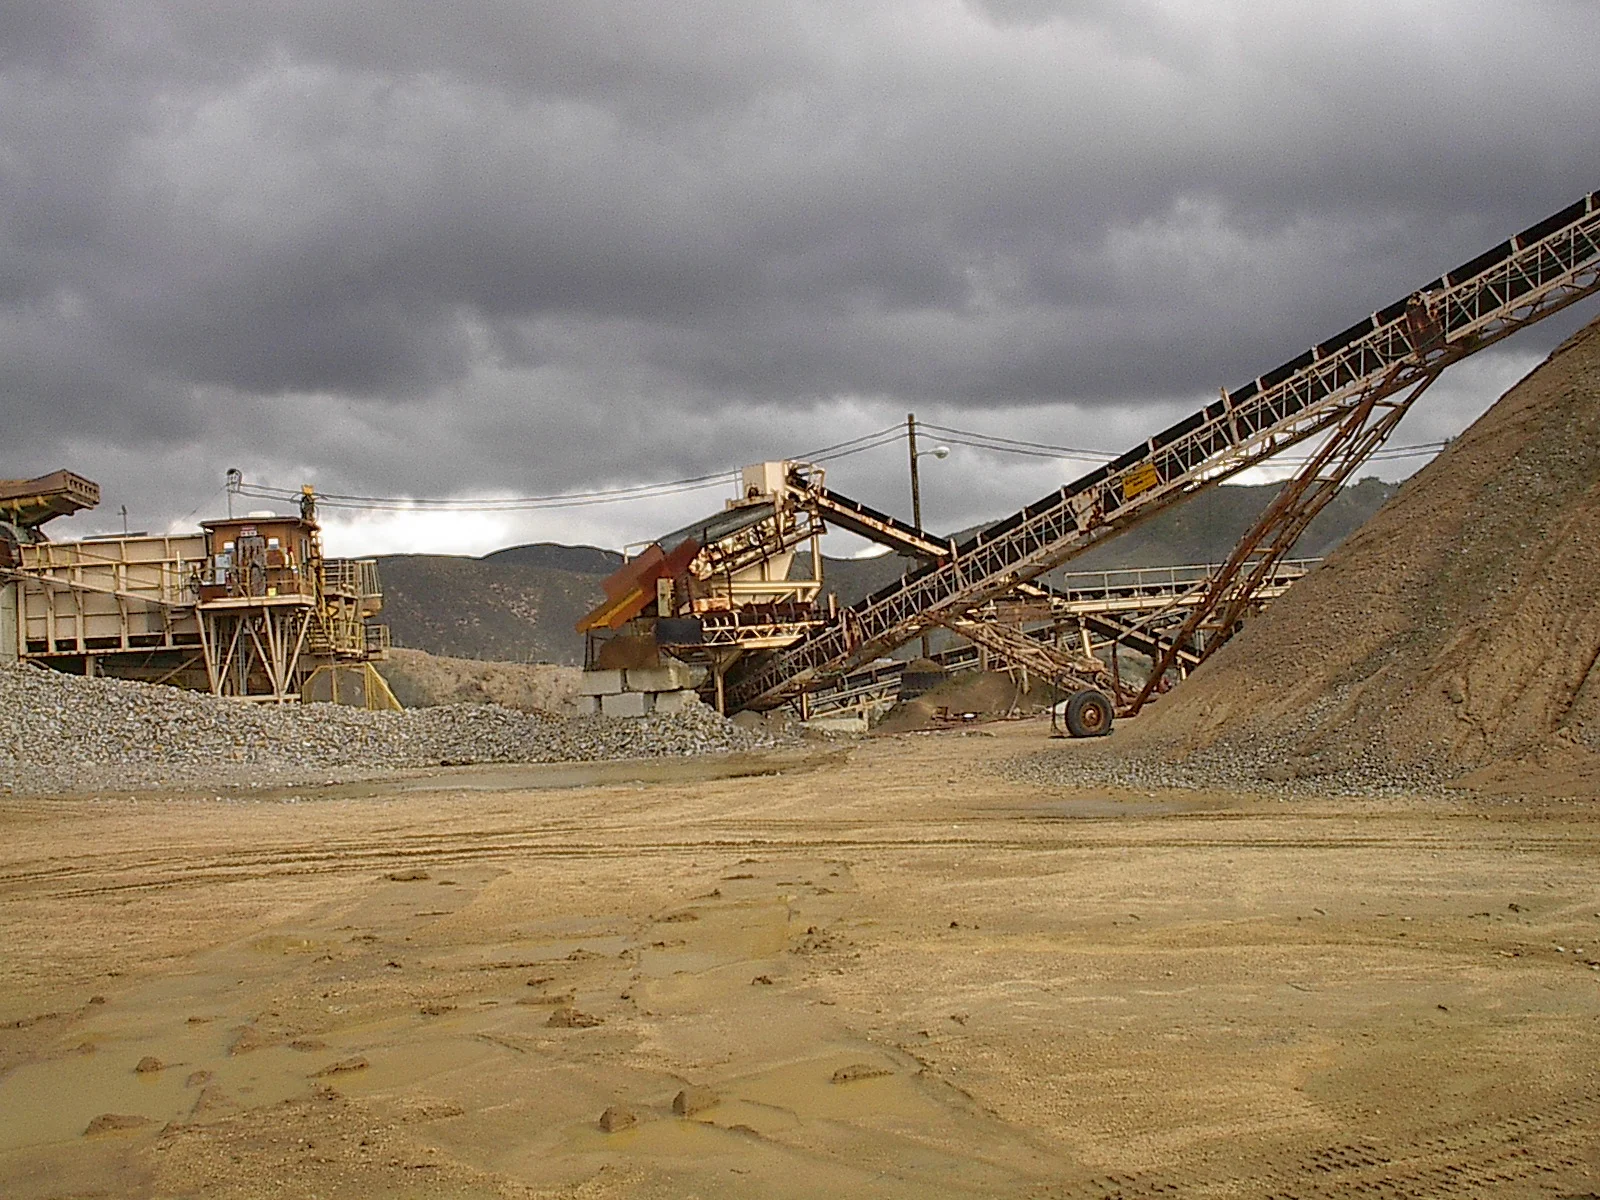
Determining the value of an aggregate deposit requires a comprehensive assessment of geological, economic, and regulatory factors. The process begins with a geological evaluation to establish the size, quality, and composition of the deposit. This typically involves site investigations such as field mapping, trenching, and drilling to determine the depth and lateral extent of the resource. Sampling and laboratory testing assess key characteristics such as grain size distribution, bulk density, hardness, durability, and absorption, which influence the material's suitability for various applications. In some cases, geophysical surveys may be used to identify subsurface features that impact extraction potential.
Once the geological data is collected, reserve estimation is conducted to quantify the total extractable material. Borehole data and geological models help determine deposit thickness and continuity, while geostatistical methods provide estimates of variability. The total volume of the deposit is then converted to tonnage using the material’s density, which varies depending on composition.
Beyond geology, marketability and economic feasibility play a crucial role in valuation. Aggregate is a high-bulk, low-value commodity, meaning transportation costs significantly impact profitability. Deposits located near major urban centers or infrastructure projects are more valuable due to reduced hauling costs. The end-use of material also affects pricing, as road base, asphalt, and concrete aggregates must meet specific standards, such as Caltrans or ASTM requirements. A competitive analysis of nearby quarries and supply-demand conditions helps assess whether the deposit can effectively compete in the regional market. Reviewing historical sales prices for comparable materials provides insight into potential revenue generation.
Regulatory and permitting factors can also influence the feasibility of extraction. Land-use restrictions, zoning regulations, and environmental considerations may limit mining operations even if the deposit is of high quality. Deposits classified under California’s Mineral Resource Zone 2 (MRZ-2) designation have already been recognized as containing significant mineral resources, making them more attractive for development. However, securing permits still requires compliance with local land use policies and SMARA.
Ultimately, the value of an aggregate deposit is determined by a combination of its geological characteristics, proximity to markets, operational costs, and regulatory constraints. A high-quality deposit with strong local demand and achievable permitting outcomes is far more valuable than an isolated resource with complex extraction challenges. Conducting thorough due diligence through geological testing, reserve estimation, market analysis, and financial modeling is essential to accurately assess the economic potential of an aggregate deposit.
Why is it So Hard to Get a Mine Permitted When These Lands Are Classified as Critical?
Even though the State of California designates certain lands as critical mineral resources under the Mineral Resource Zone (MRZ) classification system, obtaining a mining permit remains a complex and often difficult process.
While classification and designation identify lands with significant mineral resources, they do not grant automatic approval for mining. Instead, they serve as guidance for local governments to consider when making land-use decisions. Lead agencies, such as city or county governments, retain authority over land-use planning and permitting decisions, which means that even designated mineral lands can face restrictions due to zoning laws, environmental concerns, and community opposition.
Land-use conflicts are a major barrier. Many MRZ-2 areas are also located near urban expansion zones or environmentally sensitive areas. This means that by the time an operator seeks a permit, the land may already be subject to competing interests such as residential development, conservation efforts, or infrastructure projects, making approval difficult.
The regulatory process itself is rigorous. Under SMARA, mining operators must comply with strict requirements, including approval of a permit to mine (except where vested mining rights exist), reclamation plan, and responsible agency permitting demands. This permitting process is conducted through an extensive public review process. Once a project is approved, the operator must post financial assurances for reclamation. The designation of land as MRZ-2 does not exempt operators from proving that their project meets marketability, economic feasibility, and environmental standards.
Public and governmental opposition can delay or prevent approvals. While these steps aim to ensure transparency, they also provide opportunities for community groups, environmental organizations, and policymakers to challenge proposed mining projects. Even if a mineral deposit is recognized as significant, concerns over dust, noise, traffic, land use conflicts, and water usage can lead to prolonged legal and administrative battles.
Added to the exhaustive permitting process, SMARA is implemented by more than 100 lead agencies across the state. With more than 160 pages of statutes and regulations, it is difficult for lead agency staff, who spend very little time on mining projects, to effectively administer SMARA permitting and compliance.
Real-world Example
A proposed project was planned on a 73.88-acre site in a Southern California county, with a portion of the land classified as MRZ-2, indicating the presence of high-quality Portland Cement Concrete (PCC) aggregate resources. The California Geological Survey has classified these resources as critical for construction and infrastructure, and the county has incorporated them into its General Land Use Plan to ensure their availability for future extraction.
A small portion of the project site along the highway is mapped as MRZ-2, but due to highway setback requirements, this area is not considered economically viable for mining. However, the greater concern lies in the proximity of the project to a larger MRZ-2 deposit within the river floodplain. This floodplain has historically been a source of high-quality aggregate, and the project site is within 1,300 feet of these classified resources. County guidelines recognize this buffer zone as an area where development could impact the ability to secure future mining entitlements. If mining in this MRZ-2 area were restricted due to the project’s presence, the estimated economic loss from unextracted resources would be substantial.
Despite these concerns, the practical feasibility of future mining in this area remains low. The permitting process for new mining projects is complex, expensive, and uncertain. Since 1992, only one new mining permit has been issued within the subject lead agency, highlighting the significant barriers to resource extraction. Given these challenges, the project does technically encroach on the MRZ-2 buffer zone, but the likelihood of mining operations being approved and developed in this area is minimal. The only way to mitigate potential conflicts would be to redesign the project to avoid the 1,300-foot setback, but this is not considered a realistic option. Ultimately, while MRZ-2 classification highlights the presence of valuable resources, the regulatory and economic barriers to mining suggest that the proposed project will not significantly impact the future extraction of these materials.
As another example, San Diego County has a population of more than 3-million residents. Total aggregate production for the County was about 4.5 million tons in 2024. However, an estimated 2-million additional tons of construction quality sand had to be imported to the county over distances of up to 80 miles from the production source, resulting in more than 80,000 truck trips to deliver the product. Although the County holds significant MRZ-2a classified and designated resources, obtaining permits to access these resources has proven to be extremely difficult.
Conclusion
California’s aggregate industry faces a defining moment. While the state's urbanization and infrastructure needs continue to surge, regulatory hurdles, community opposition, and environmental restrictions threaten the very resources that make development possible. The demand for aggregates isn’t going away—if anything, it’s increasing. Yet, without a balanced approach to permitting and resource management, California risks crippling its own construction sector, driving up costs, and becoming overly reliant on costly imports.
The contradiction is clear: California designates mineral lands as essential for development, yet the bureaucratic and political landscape often makes accessing these resources nearly impossible. If policymakers fail to address these barriers, infrastructure projects will face severe delays, economic growth will stall, and the state will find itself caught between environmental ideals and the harsh realities of construction demand. The path forward isn’t about choosing between progress and preservation, it’s about finding a way to responsibly harness the resources necessary to build California’s future. The question is: will the state rise to the challenge, or will it allow its most vital construction materials to be buried under red tape?